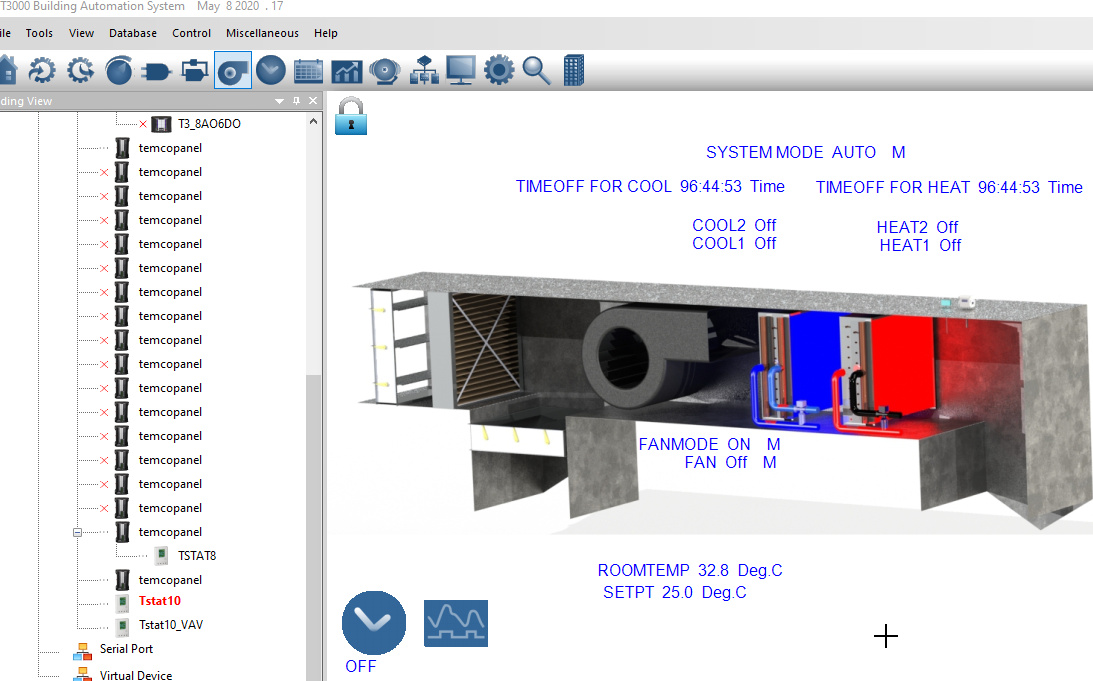
I have loaded the Office Heating Example “Heating.prog” into a Virtual T3BB and “2Heat2CoolRev3.prog” into Virtual Tstat10. Each have a JPEG image in their directory that were provided. In both programs, there is an Element Count when the program is first loaded but I do not see any elements on the graphics. If I add a point or points to the graphic then the element count changes to the number of points I have done and the original elements seem to be lost?
Are there items that should overlaid on the graphics in these examples?
Are items (points) always on top? or how do you send the graphic to the back and bring the items to the top?
On the items I create, I can move them but they always revert to where they were inserted. How can I move and save them?
Will the T3000 software act differently when connected to a real live device vs a virtual?
It appears the there is no way to run or simulate a virtual device. Is that correct?
I read that the graphics are stored on the controller its self. Is that true for the Tstat10?
I know, lots of questions for a newbie…
Any help would be greatly appreciated!
-Thanks