It would be great to be able to download the trend log data somehow, in a CSV file format for example. Please let me know if I’m missing an existing way to already do this? Thanks, and great work!
1 Like
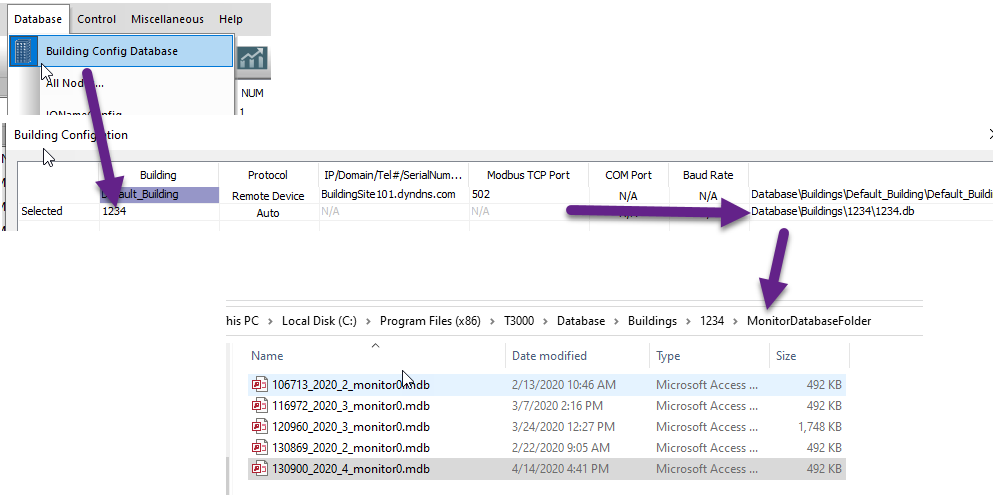
The data is there in the T3000 folder, each building in your ‘Building Database’ gets a separate folder, in my example building here the folder is called 1234.
C:\Program Files (x86)\T3000\Database\Buildings\1234\MonitorDatabaseFolder
The data is stored in a Microsoft Access *.mdb database format which is easy to import to Excel and other data bases.
Here is another look at it. The example shows the long directory path to navigate to find those files. I have
uploaded a screen shot similar to the one Maurice provided. I have highlighted the section of the file name that contains the serial# of your T3. This example shows what it looks like when you have multiple T3’s. In my case I have four of them. Please notice that these are all Microsoft Access files. (note the .mdb suffix) I would recommend that you get Access on your PC. Then you can really look at/manipulate these mdb files. The mdb related file is created /updated each time you run a Trend Log. You’ve probably noticed it doing a download every time you run a graph. This seems to be where the data is going and is probably what the T3000 software is using to create the graph.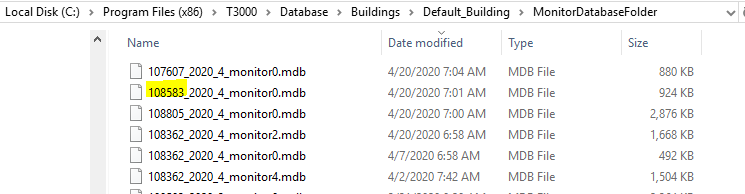
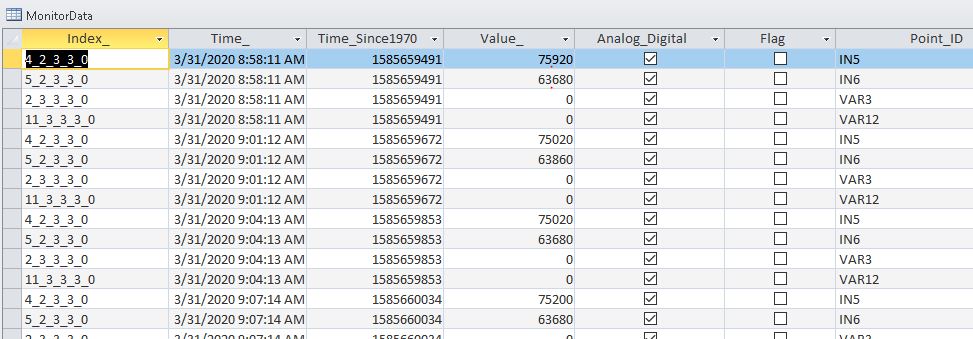
Once you open the mdb file for your T3, you’ll see the MonitorData table. Here is what mine looks like: This is 10 minutes of data from my CoolingTower T3 on March 31st. As you can see, I have the Trend log set to record data every 3 minutes. IN5 is the water temp inside the tower, IN6 is the outdoor air temp, VAR3 is the actual speed of the tower and VAR12 is the recommended speed from my PID loop Those two last variables are both zero because the outside air (63.68F) is keeping my CoolingTower water (75.92F) below the set point. Also, note that I have drawn a couple of red dots on this example to let you see the implied decimal point.
To use this effectively, you’d need to build your own Access table containing the defined the "Point_ID"s with actual descriptions. Then create a Query to cross reference the tables.Then you could easily output/export a .csv file for any date and time range with an access query. Or if you don’t want to learn Access, you can just use Access to export the table in CSV or .XLSX Excel format and analyze it there.
Hope this helps.
Thanks Ted. I can see we need a better way of reporting whats inside these databases, if you don’t mind sharing we can do something similar directly in the T3000 application.
Thanks to you both! We’re wiring the unit up to a pair of chillers later today, I’ll try to get Access loaded on the computer to read the database.
Thanks again for your detailed notes!
You can also import them into Excel which is a little easier for most folks to work with.
![]()