Hi,
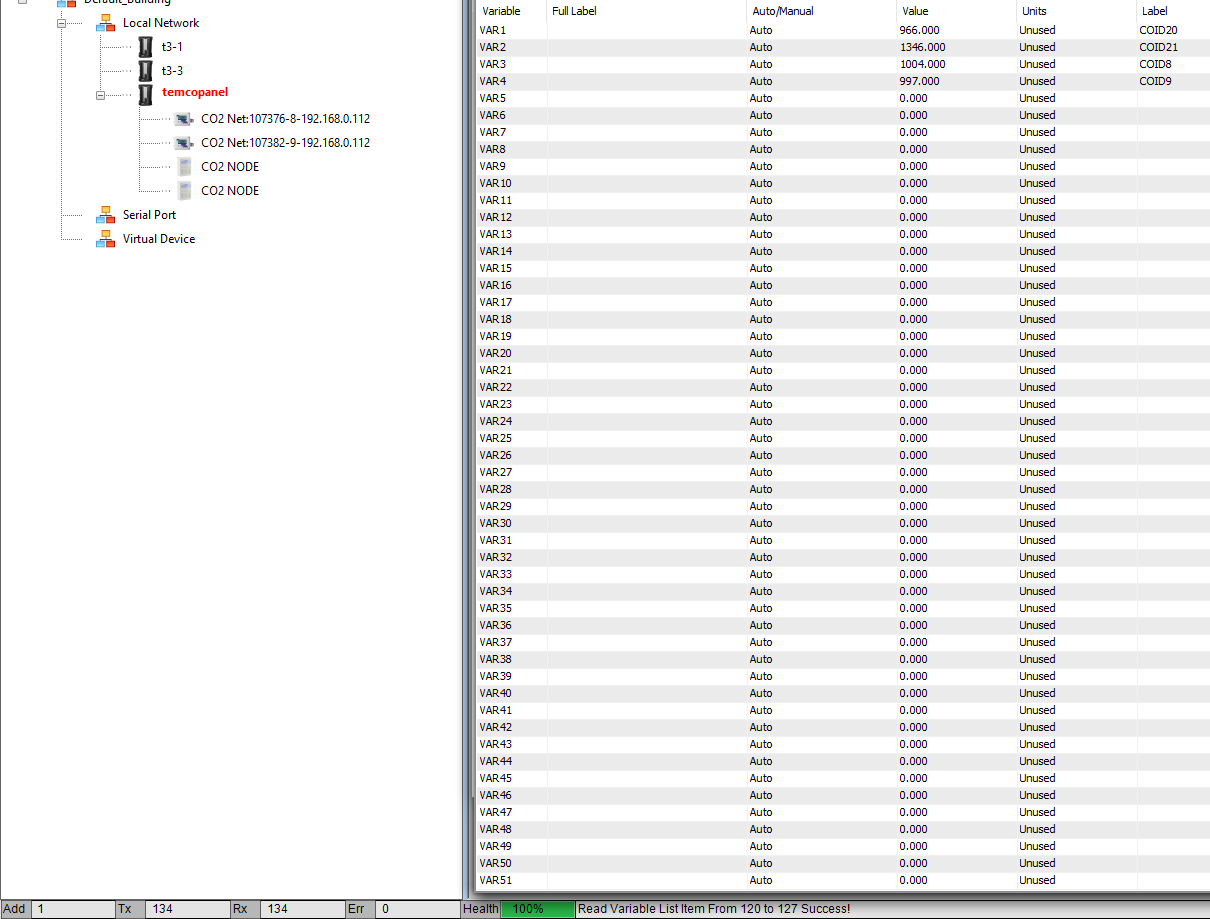
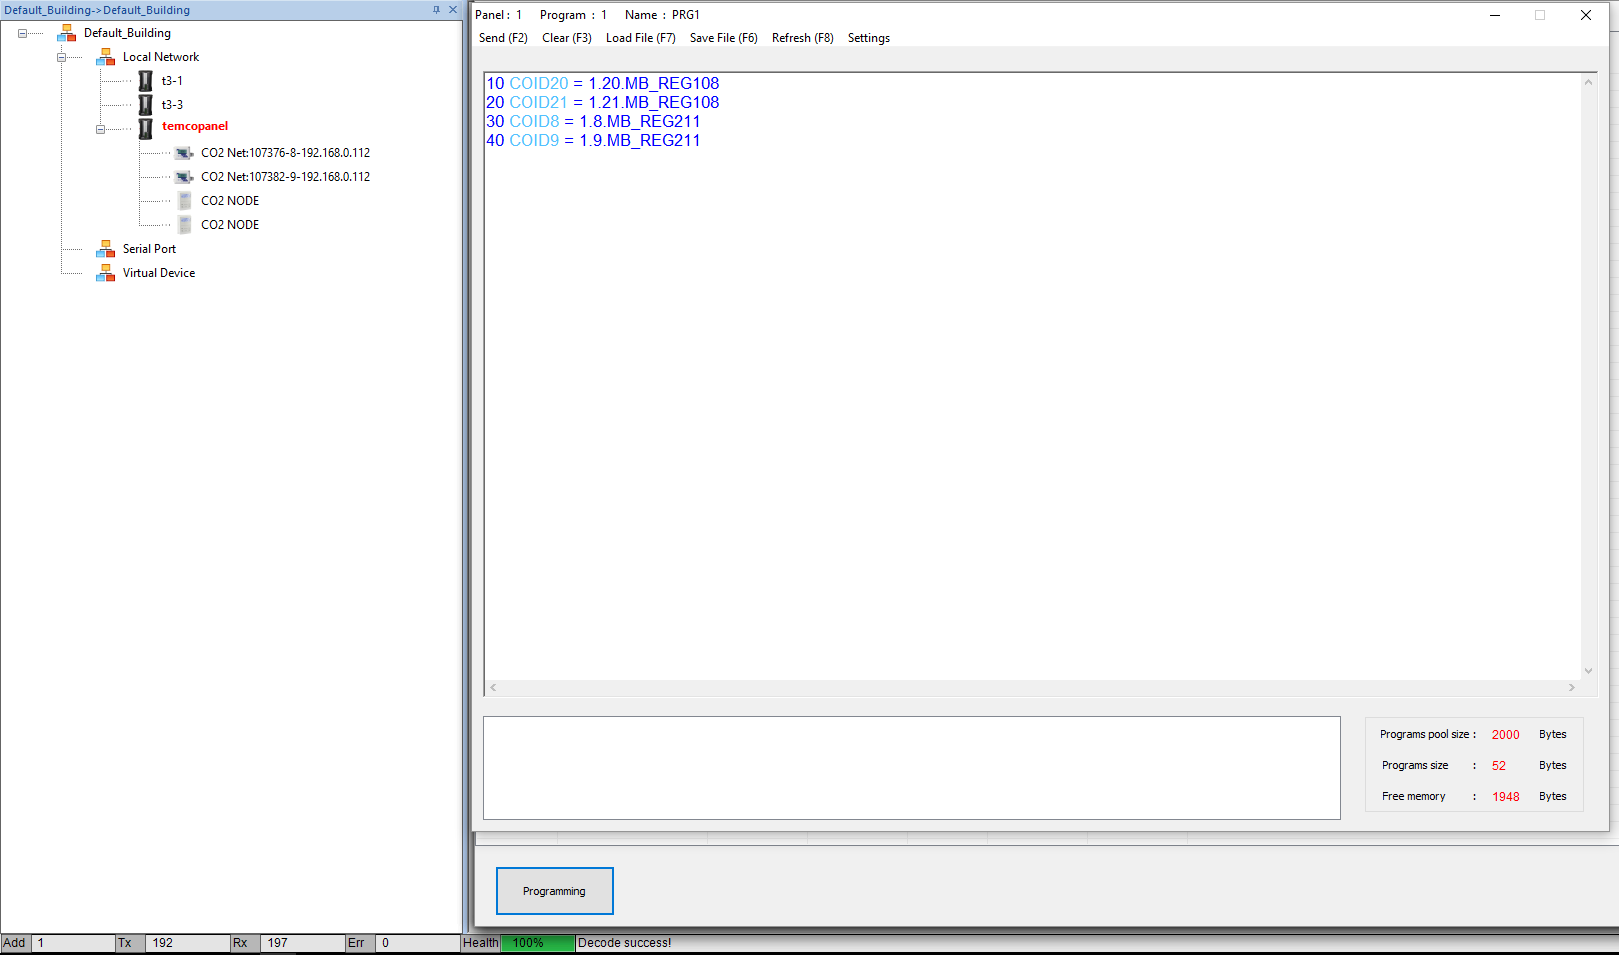
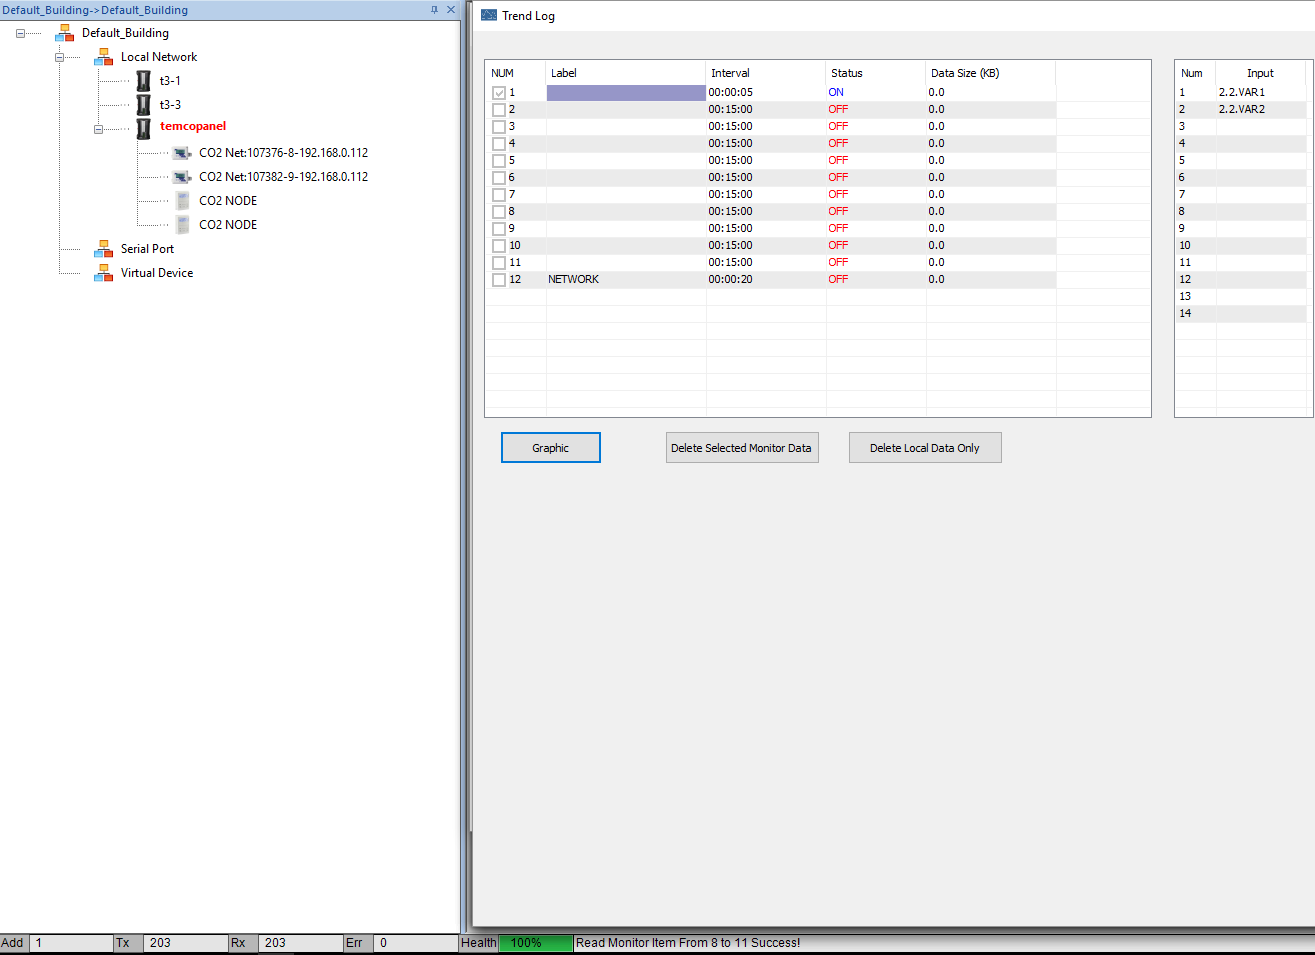
I am stuck, can’t make graf to work, already reseted and renamed VAR a lot of times, all looks ok, sust trend graphs do not showing. In VAR table all values are in place, this means all is fine with network, controller is reading values, but for some reason no trend is logged.
I was just about to study this whole thing as i am having the same problem in getting trend logs to work.
Looks like i can read this and get a few more ideas.
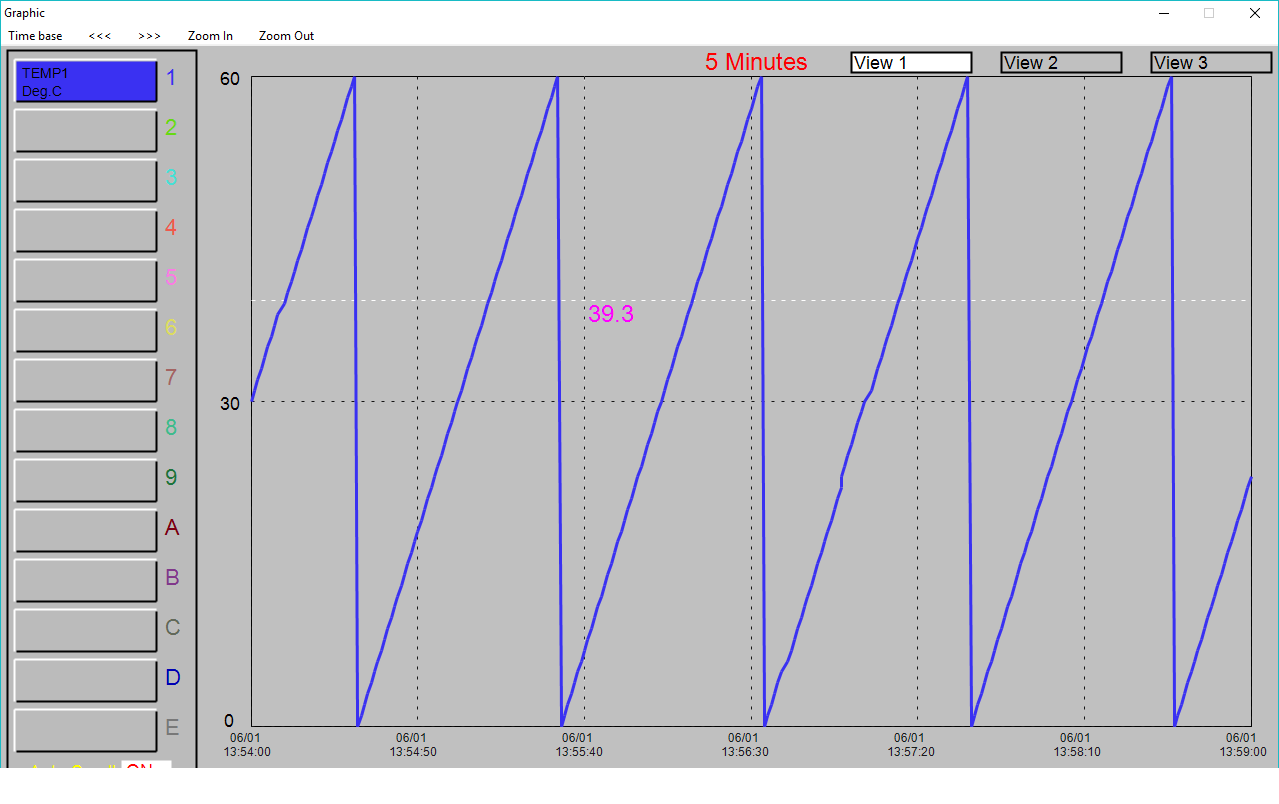
I am trying to get a graph of straight analogue inputs such as temperature etc and still having trouble.
I dont have a card in slot as i read somewhere that all the new T3 BB have onboard memory soldered in place.
Was going to add card tomorrow to see if required as tried everything else.
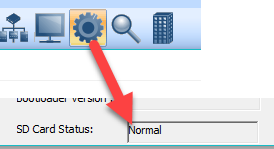
In my case i will have units in place as std inputs but will check SD Card Status and put in a card to see what happens.
SD card status - normal
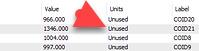
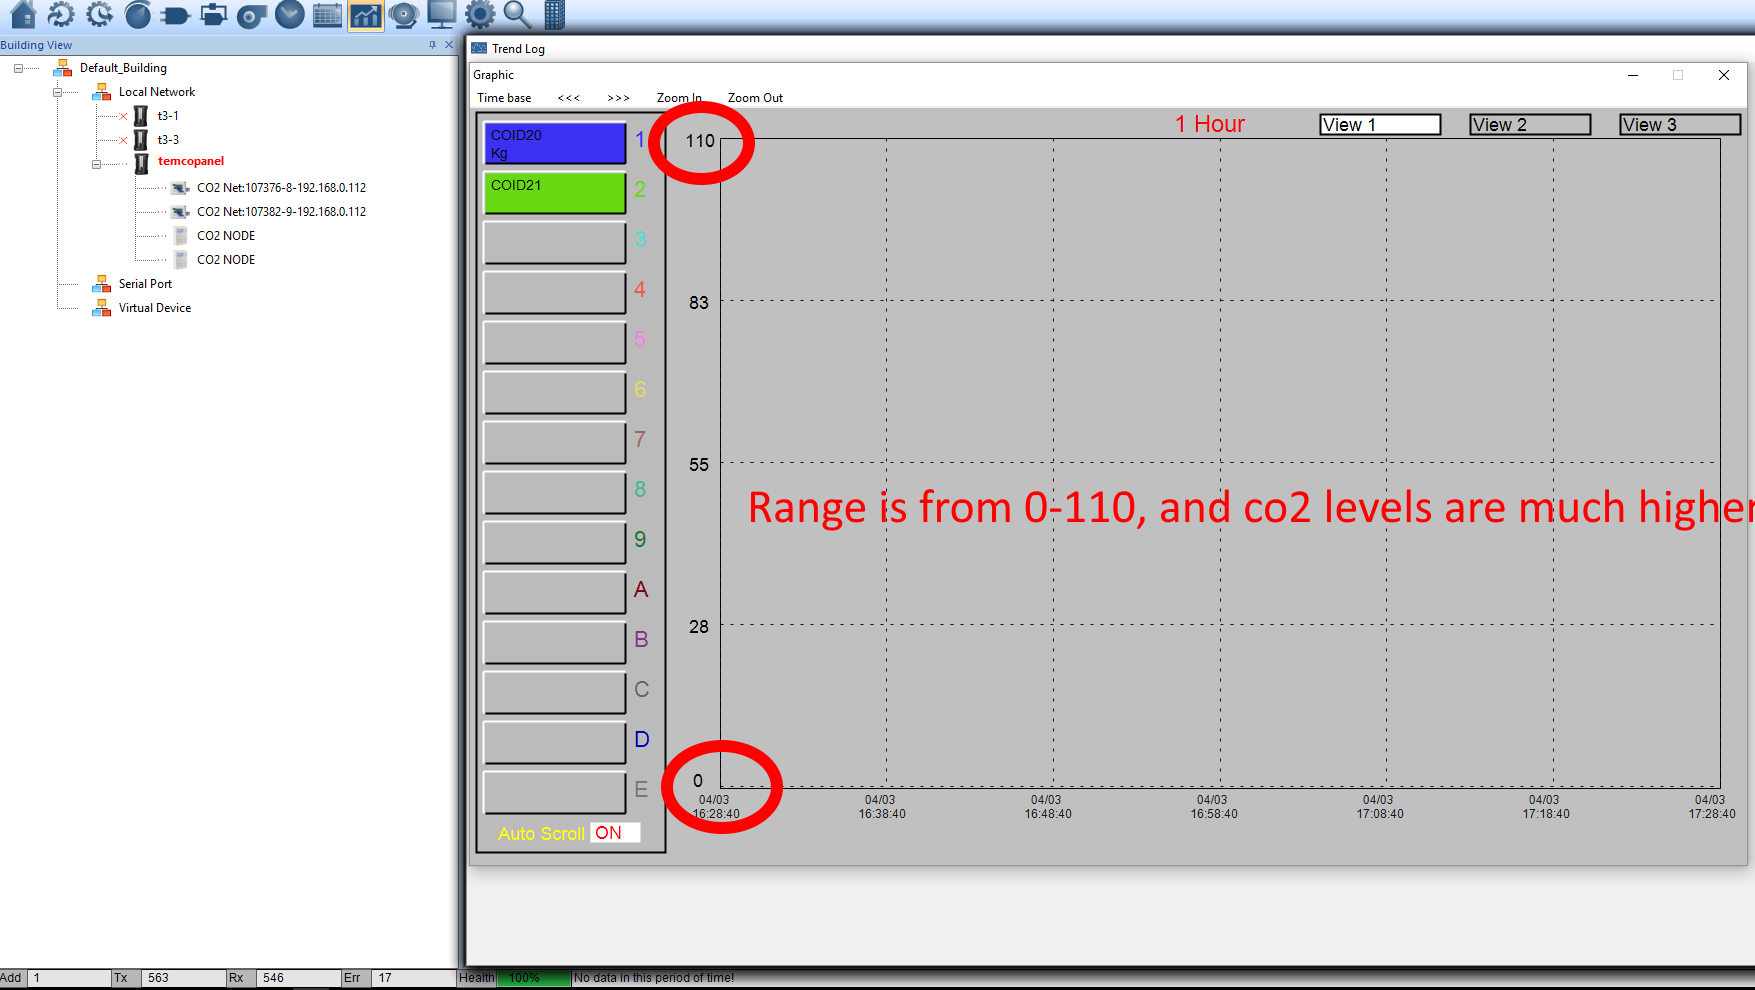
I tried change units (range), but there are no PPM in the menu, so i tried to create ppm, this gave no result, also tried to change to few other available options (w, kg…). That unit is best to use for co2 ppm, range is 400-2000?
Tried two memory cards.
Tried restart controler
Tried clear controler
updated firmware
Tried 3 different computers
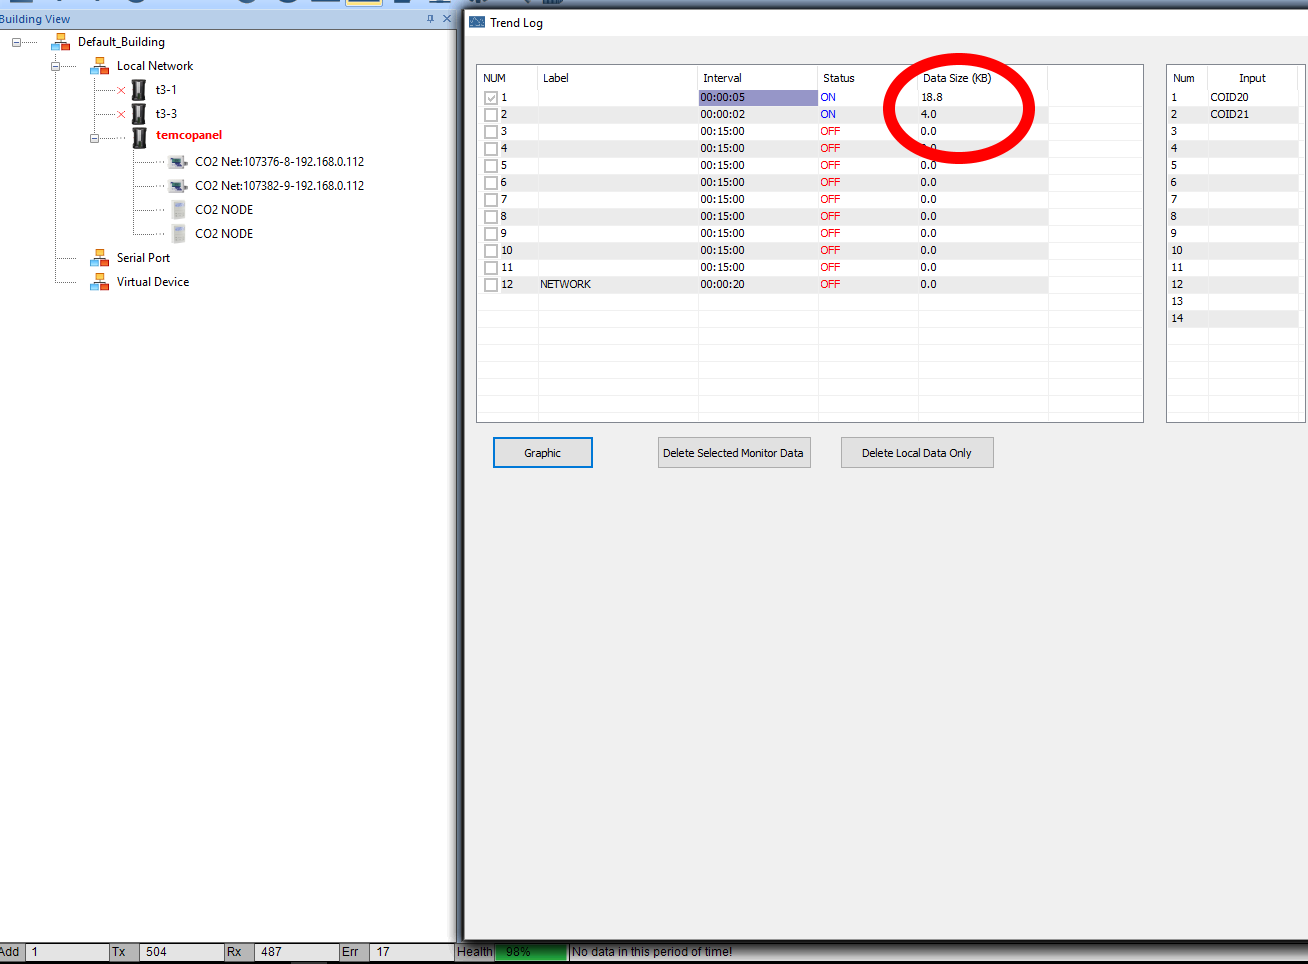
also added trend logging for Analog inputs, AI1 signal 9.98V AI2 -0V also no result.
andrius
you got further than me as i cant get any data size but other than that exactly the same.
i had had the pleasure of Chelsea from Bravo come into my setup twice using Teamviewer and she is good and knows her stuff. Might be time for another Teamviewer session.
Update
I now have a SD card in and at least I am getting data accumulated. Just cant view it.
The trend logs work now but some only update the graph at around 25 minute intervals which make it difficult if you are trying to capture an event.
I askd before about printing a graph, which would be nice, but until that is done is there anyway to capture the information for documentation ?
For now the data is only view-able in the T3000 trend log views, and printed using a screen capture tool or similar. The data is available in Microsoft Access format in the T3000 install folder, on my machine its located here:
C:\Program Files (x86)\T3000\Database\temp\MonitorDatabaseFolder\XXXXXXX
Where XXXXXXX is the serial number of the controller.
Admittedly we need some better reporting tools and a more logical file keeping system. Have added this to the todo list.
One tip I just discovered myself, our developers have added a way to see the value of the various items on the graph, right click and the value will show as the mouse hovers over the graph.