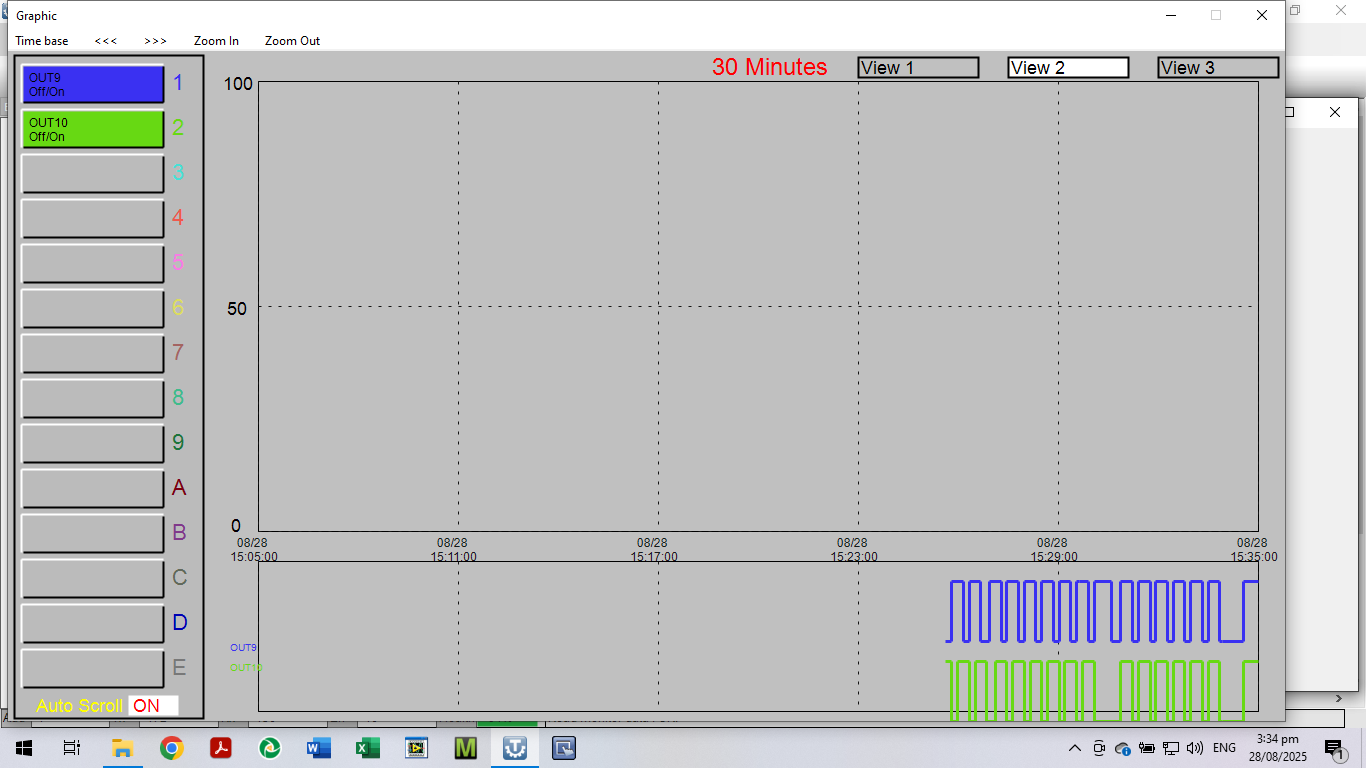
Just trying trend graphic to check test operation.
I am monitoring 2 DOs which are cycling on-off.
See attached screenshot - the 2 traces are vertically displaced. This is actually helpful to see the result clearly (rather than have the traces overlap) - but second trace is partly off-screen. How can I fix this??