1. Overview
The Trend Log function is designed to periodically sample and record historical data from inputs (IN), outputs (OUT), and internal variables (VAR) of T3 series controllers. It provides both real-time trend visualization and historical data playback, and is widely used for system commissioning, performance analysis, and fault diagnostics.
Currently, T3000 supports two trend logging mechanisms:
• Legacy Trend Log
• Trend Log Beta (new-generation logging system)
These two systems differ significantly in terms of data storage architecture, operating behavior, and intended usage scenarios.
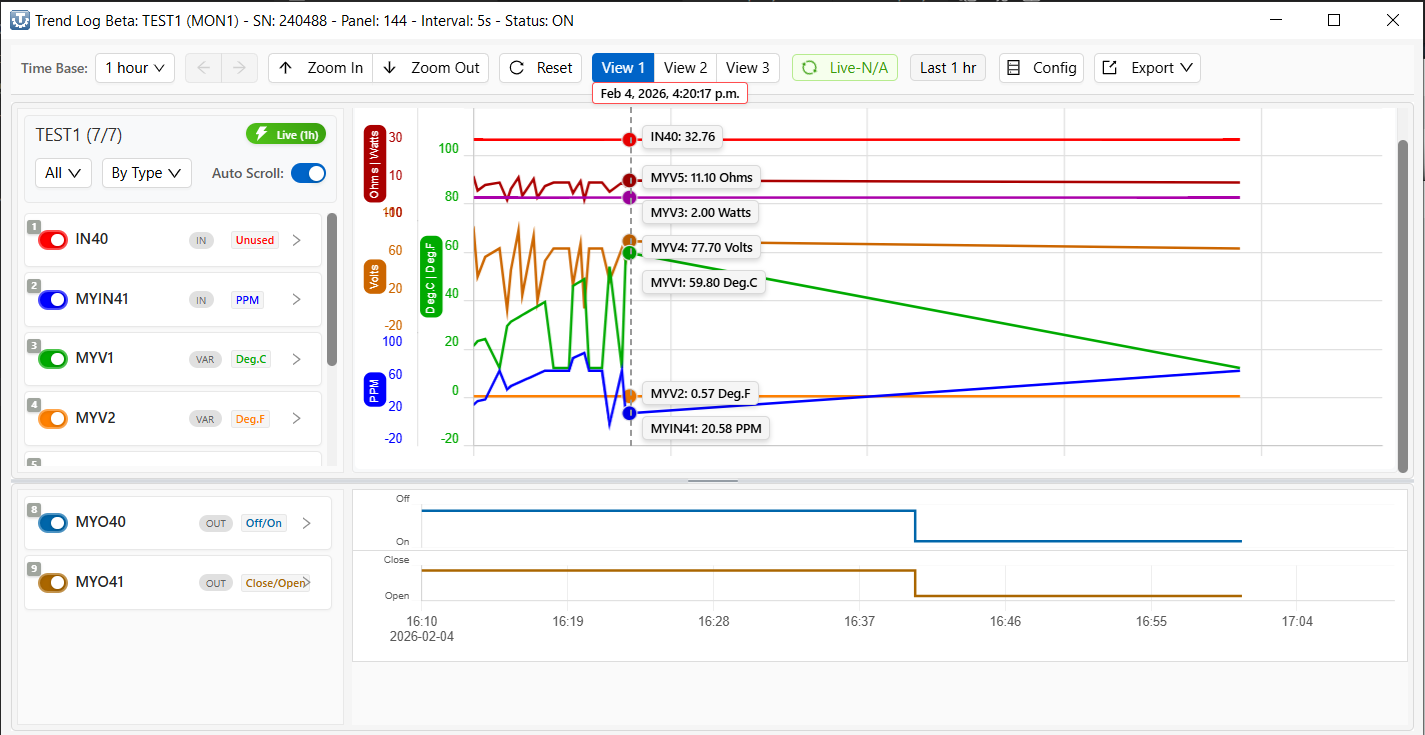
2. Trend Log Beta (Recommended)
Trend Log Beta is the new-generation trend logging system in T3000 and is the recommended solution for new projects and ongoing system analysis.
It is designed to provide higher logging resolution, broader coverage, and improved scalability compared to the legacy Trend Log.
This system introduces a redesigned logging engine and a dedicated Graphic Beta interface for trend visualization and historical review.
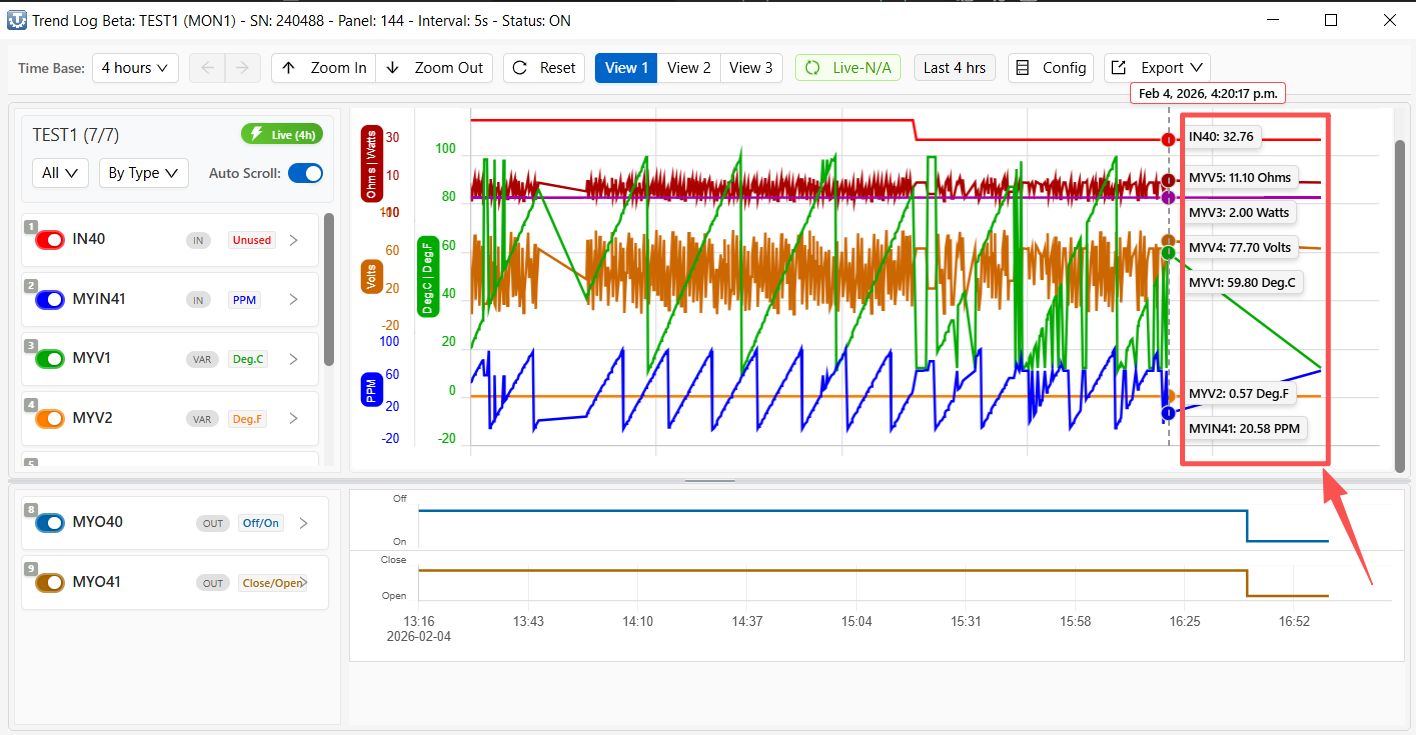
2.1 Key Features
• Supports second-level logging intervals (e.g. 5 s, 10 s), suitable for commissioning and fast-changing signals.
• Logs both:
o Analog points (e.g. temperature, pressure, voltage)
o Digital points (e.g. status, on/off signals)
• Trend data can be collected from:
o Inputs (IN)
o Outputs (OUT)
o Internal variables (VAR)
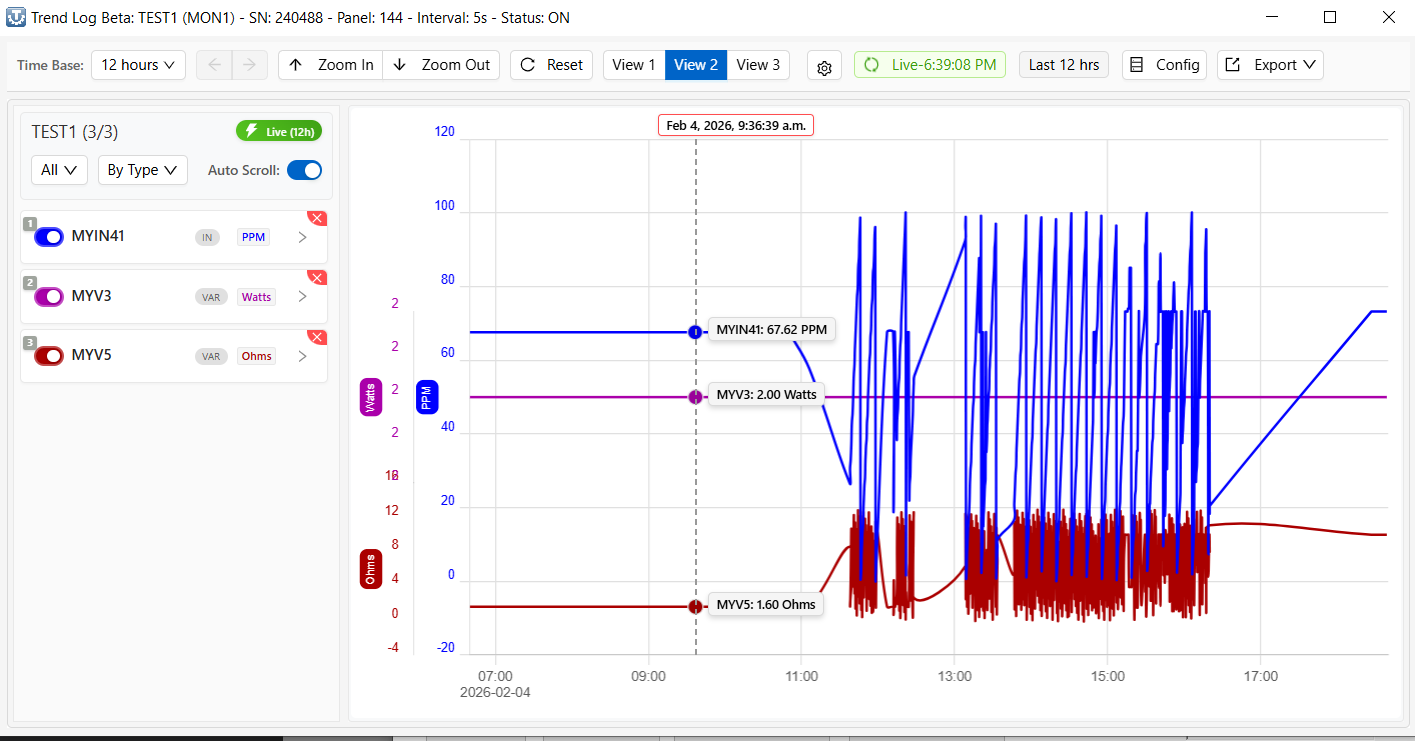
• Multiple Trend Monitors can run simultaneously on the same controller.
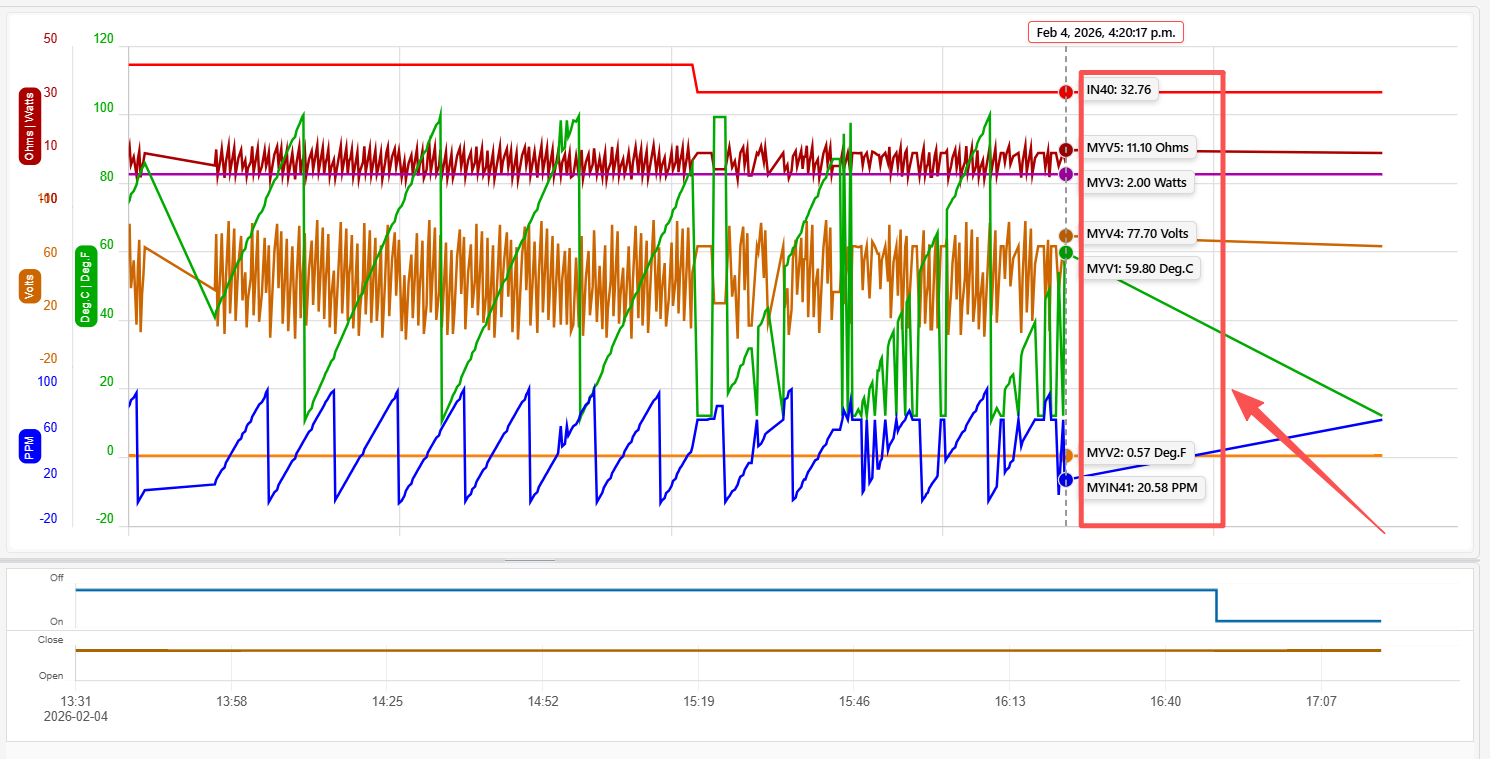
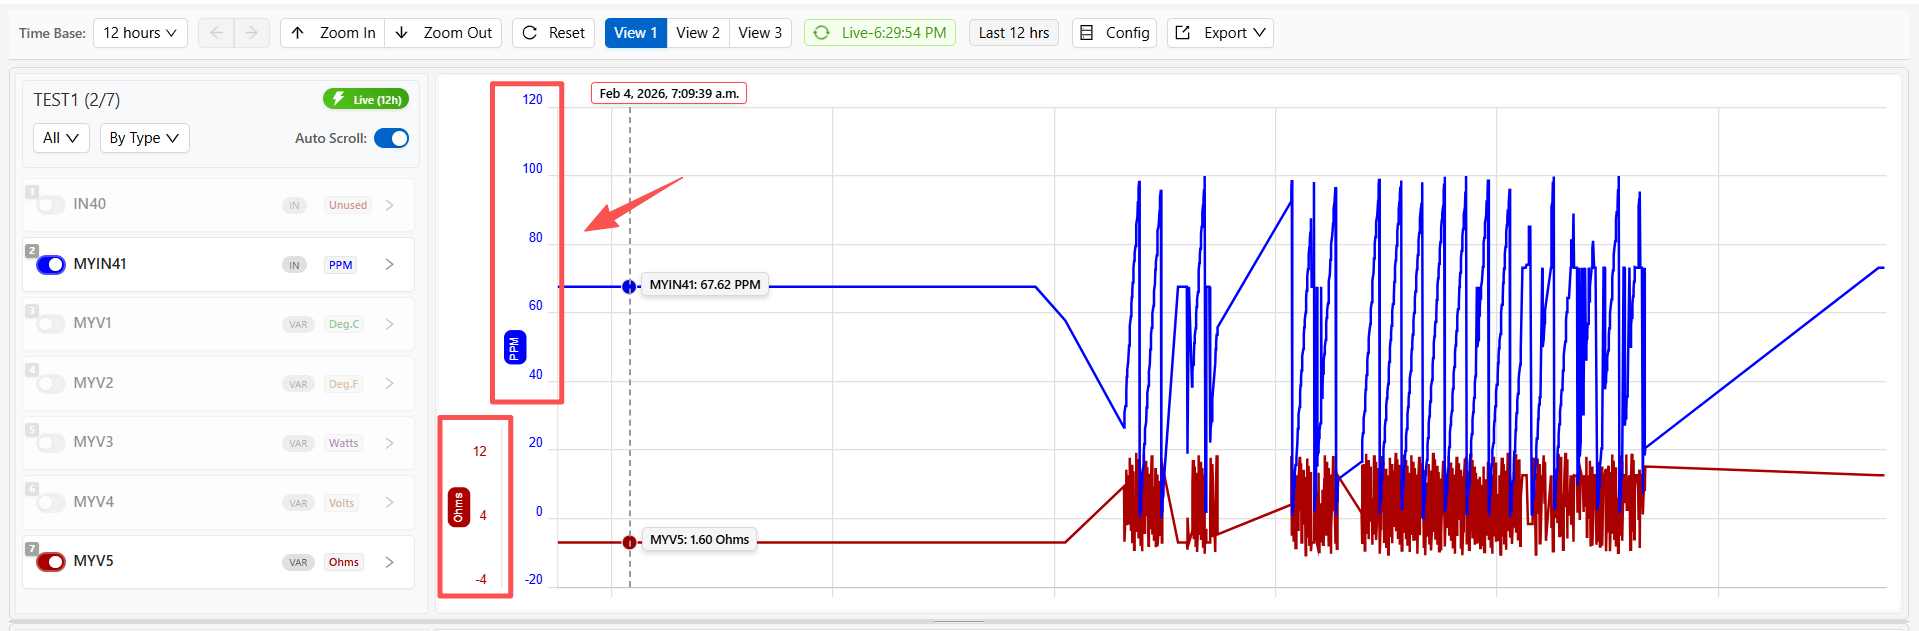
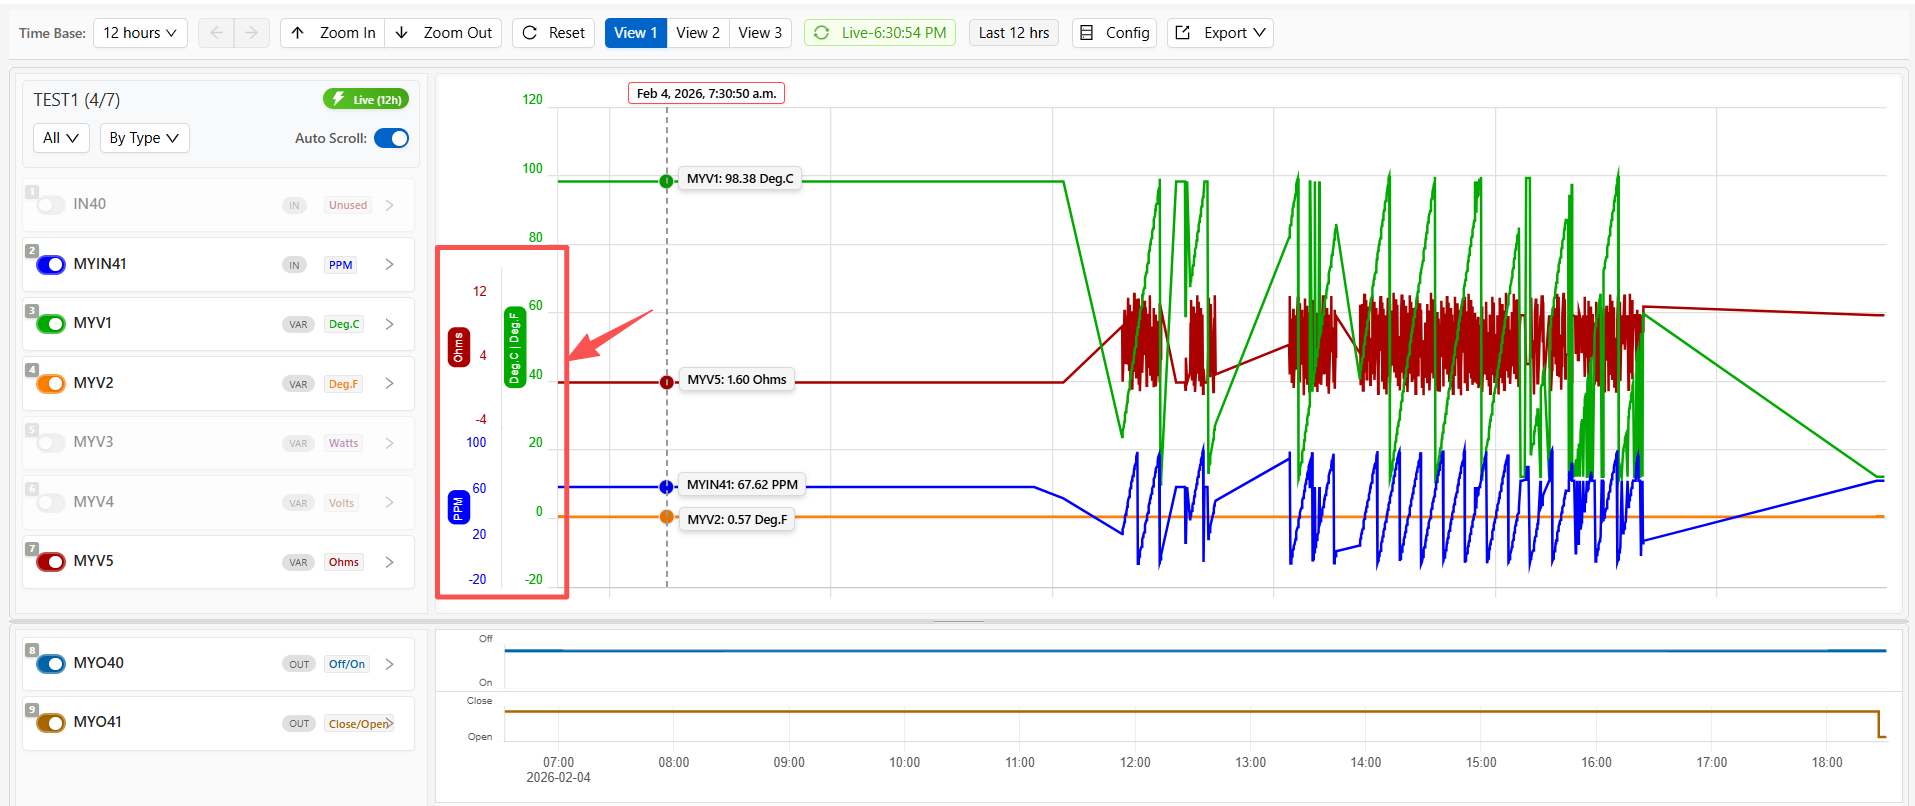
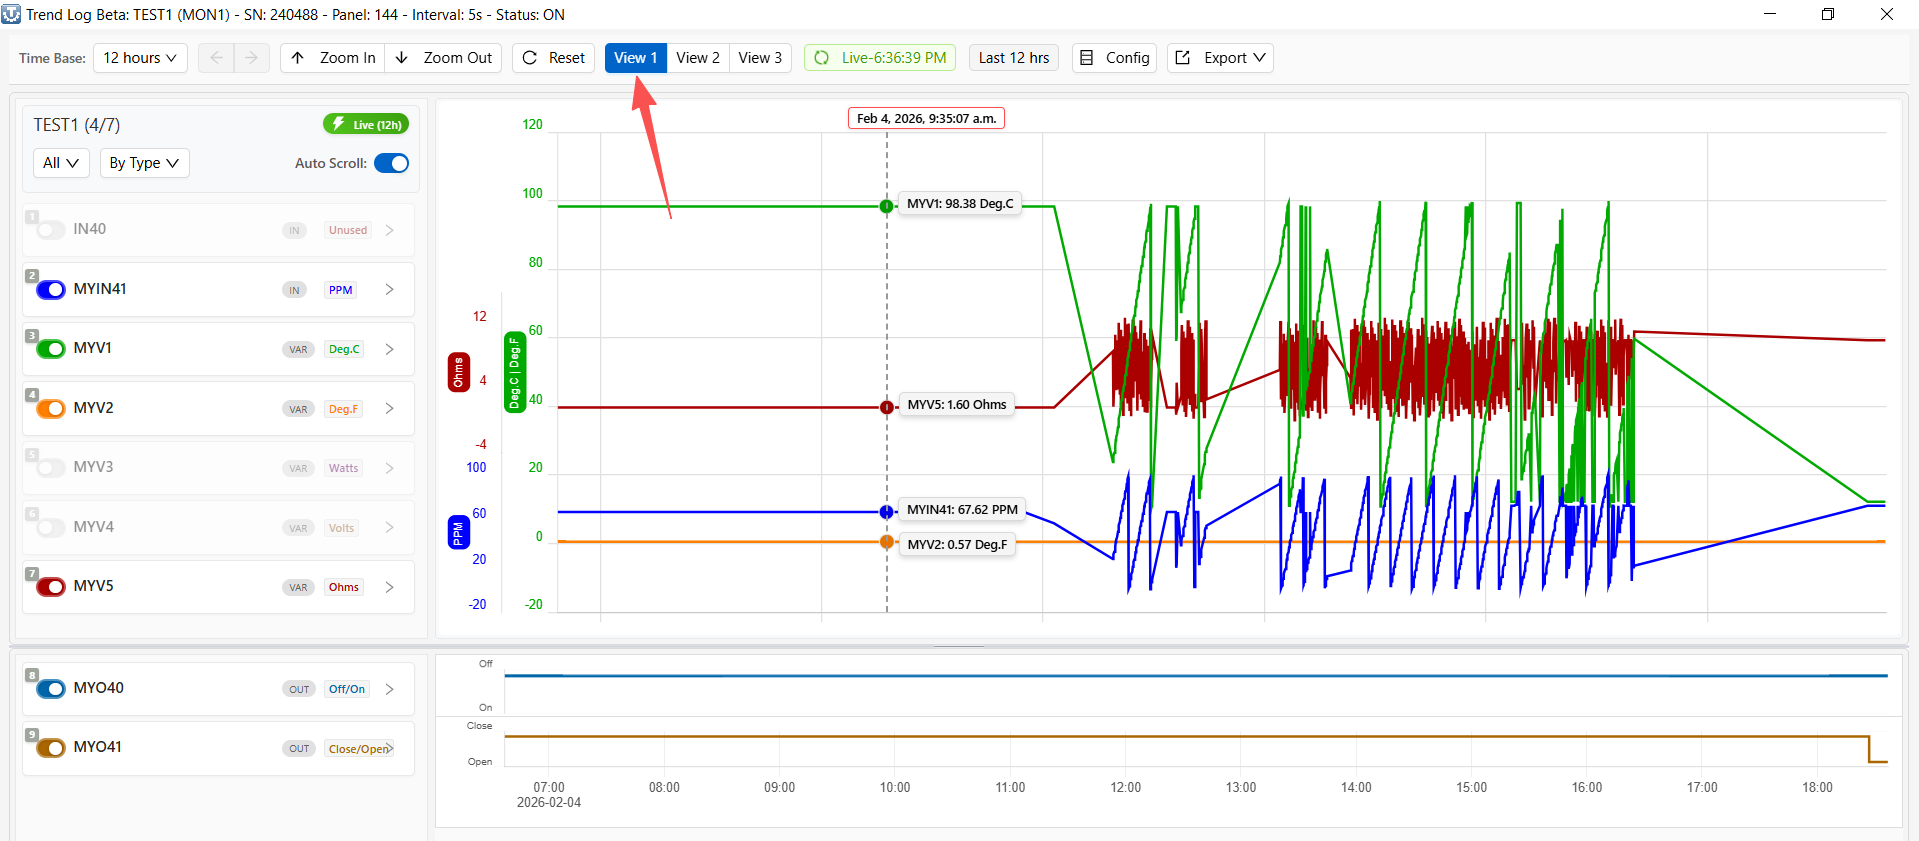
• A dedicated Graphic Beta interface is provided for:
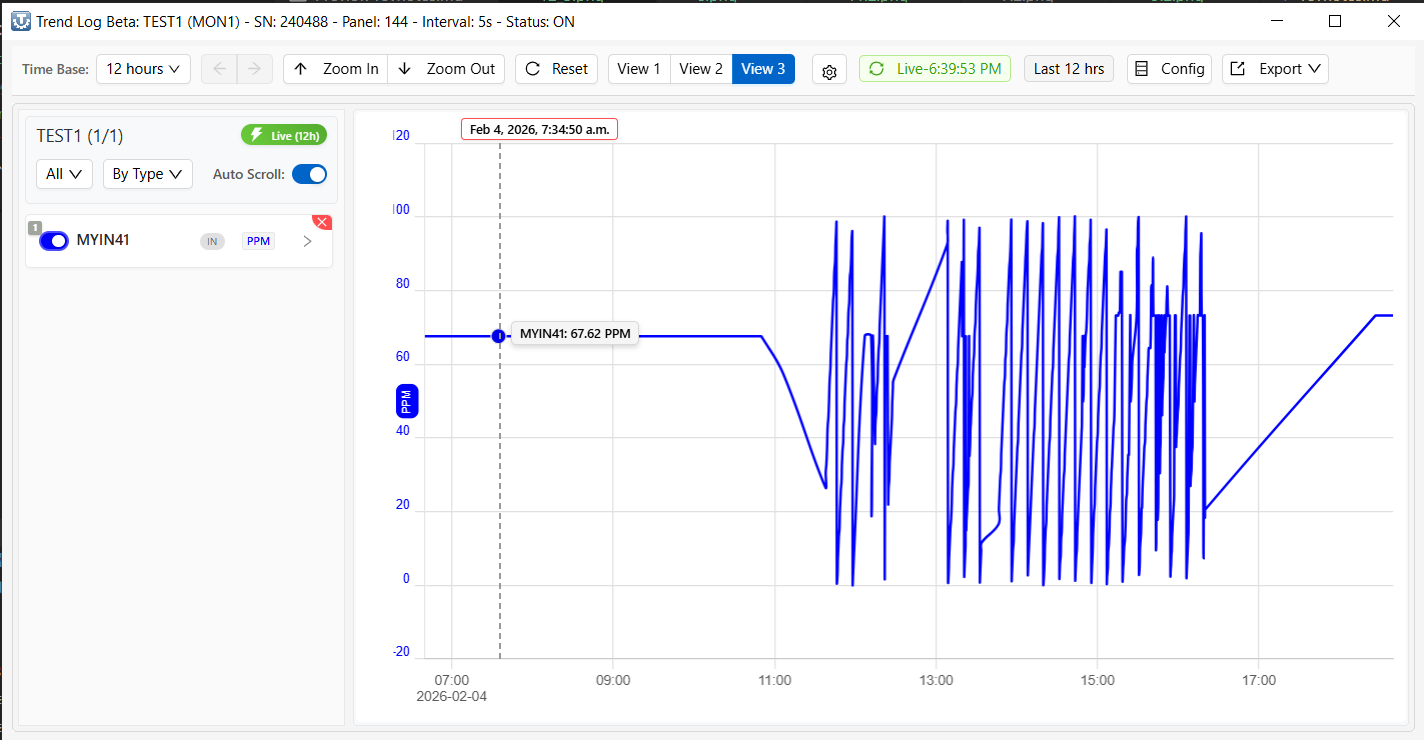
o Real-time trend display
o Historical data playback
o Multi-point overlay and comparison
Trend Log Beta operates as a background service within T3000 and is independent of the currently displayed user interface.
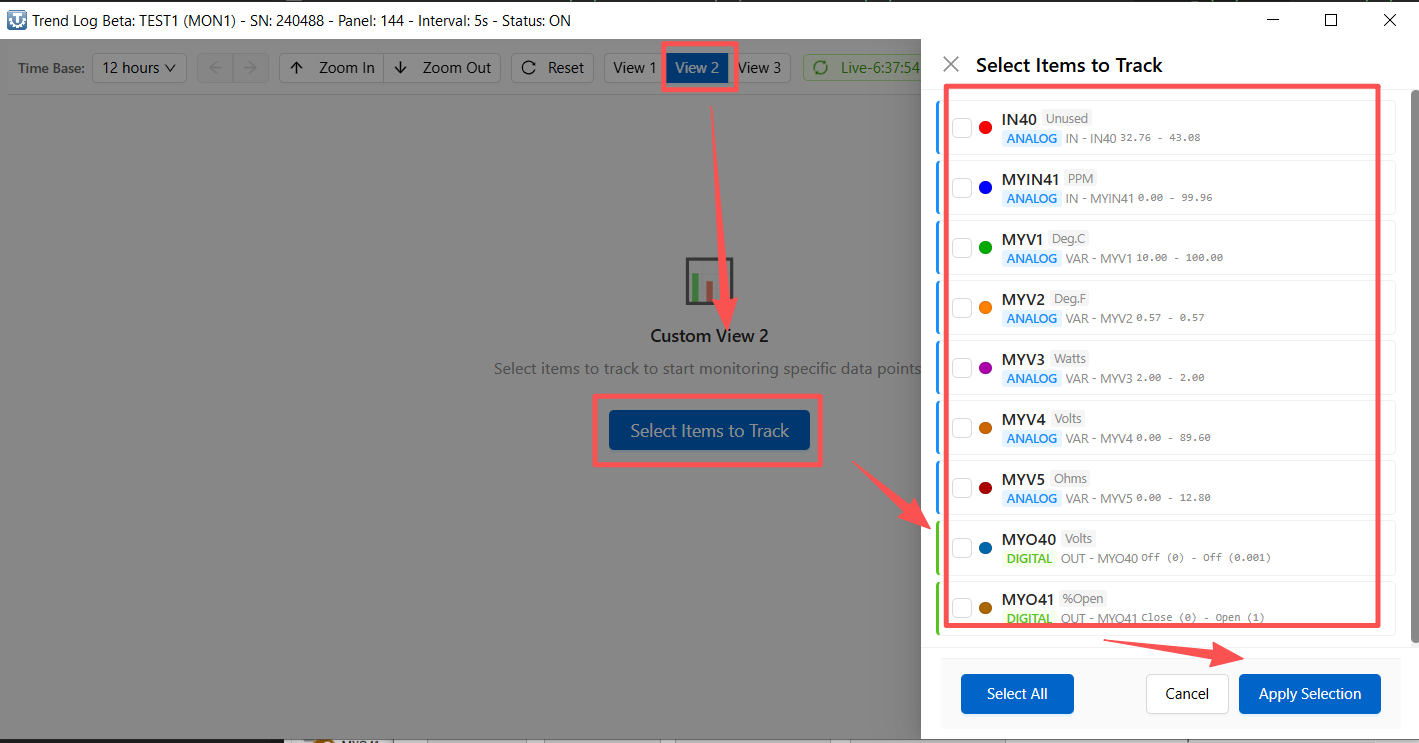
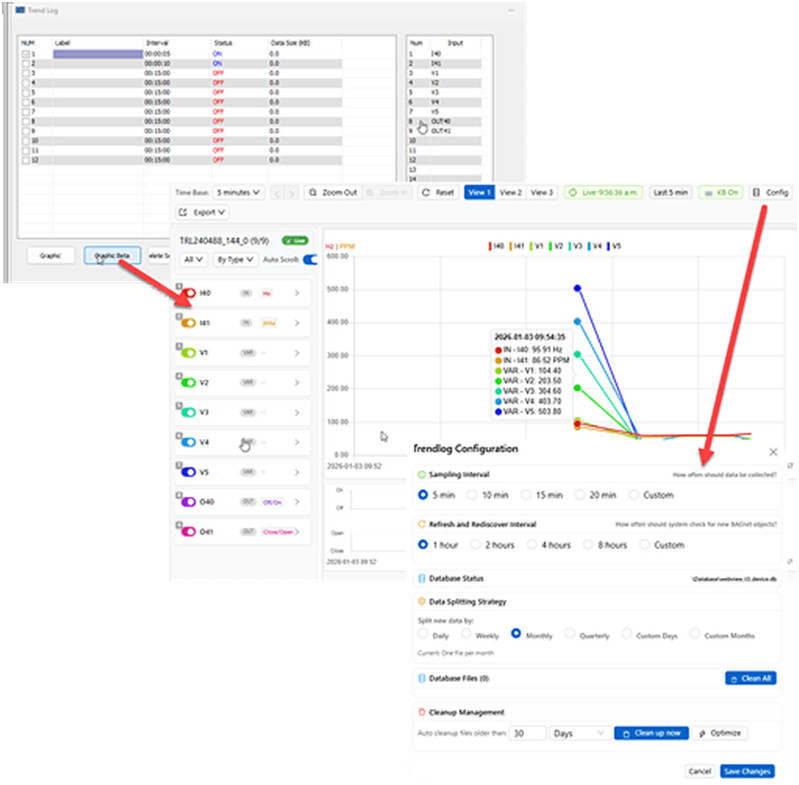
2.2 Trend Monitor Configuration
Trend logging in T3000 is organized around Trend Monitors.
Each Trend Monitor defines a group of points and the sampling behavior applied to them.
For each Trend Monitor, the following parameters are available:
Parameter Description
Interval Logging interval. The value can be configured in seconds or minutes.
Status ON / OFF. Only monitors set to ON will be logged.
Point List Selected inputs (IN), outputs (OUT), and variables (VAR).
Data Size The amount of data currently accumulated for this monitor.
Notes:
• Only Trend Monitors with Status = ON participate in data logging.
• Trend Monitors set to OFF do not consume storage or processing resources.
• Multiple Trend Monitors may be active simultaneously on the same controller.
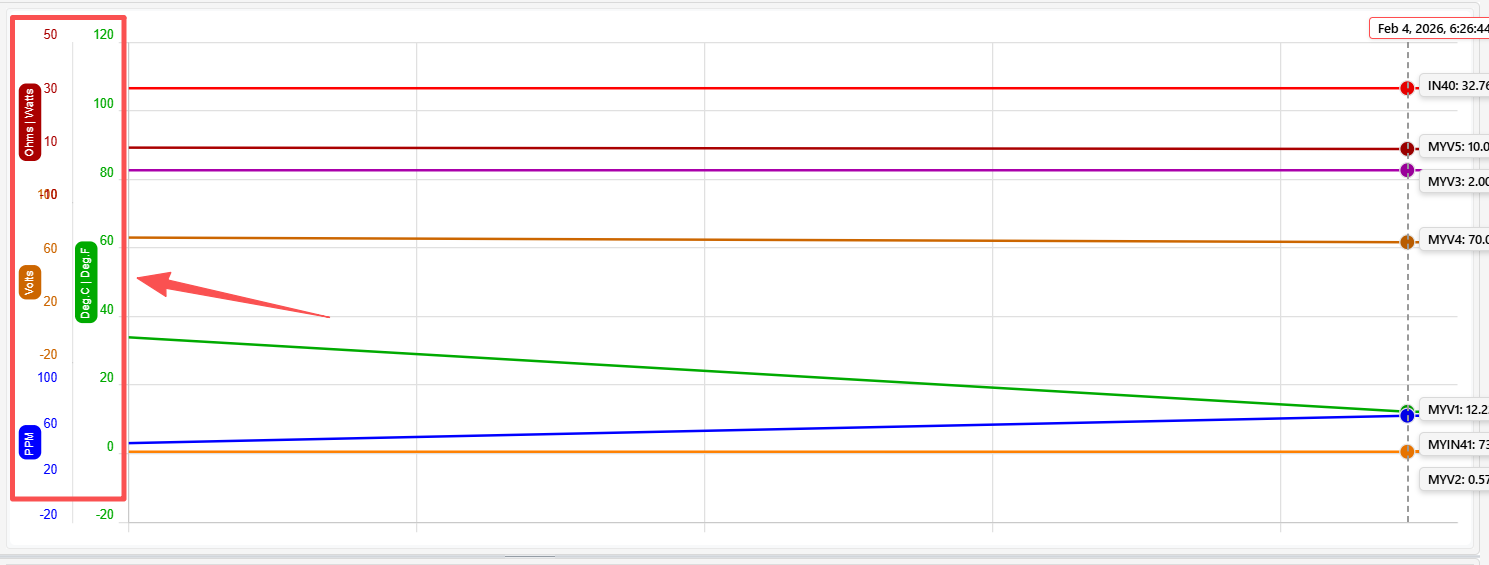
2.3 Logging Behavior
Trend Log Beta operates as a background logging service within T3000.
The following behavior should be noted:
• Trend logging continues regardless of:
o Whether the Graphic Beta window is open
o Which page or device is currently displayed in T3000
• All configured points within an active Trend Monitor are sampled using the same logging interval.
• Analog and digital points are recorded using a common time base.
o Any perceived offset between analog and digital trends is typically related to display refresh timing rather than the underlying log data.
• During activities such as:
o Program editing
o Page switching
o Device tree navigation
trend logging continues to run in the background.
o In rare cases, individual samples may be skipped; this behavior is under ongoing optimization.
2.4 Trend Log Configuration (Global Settings)
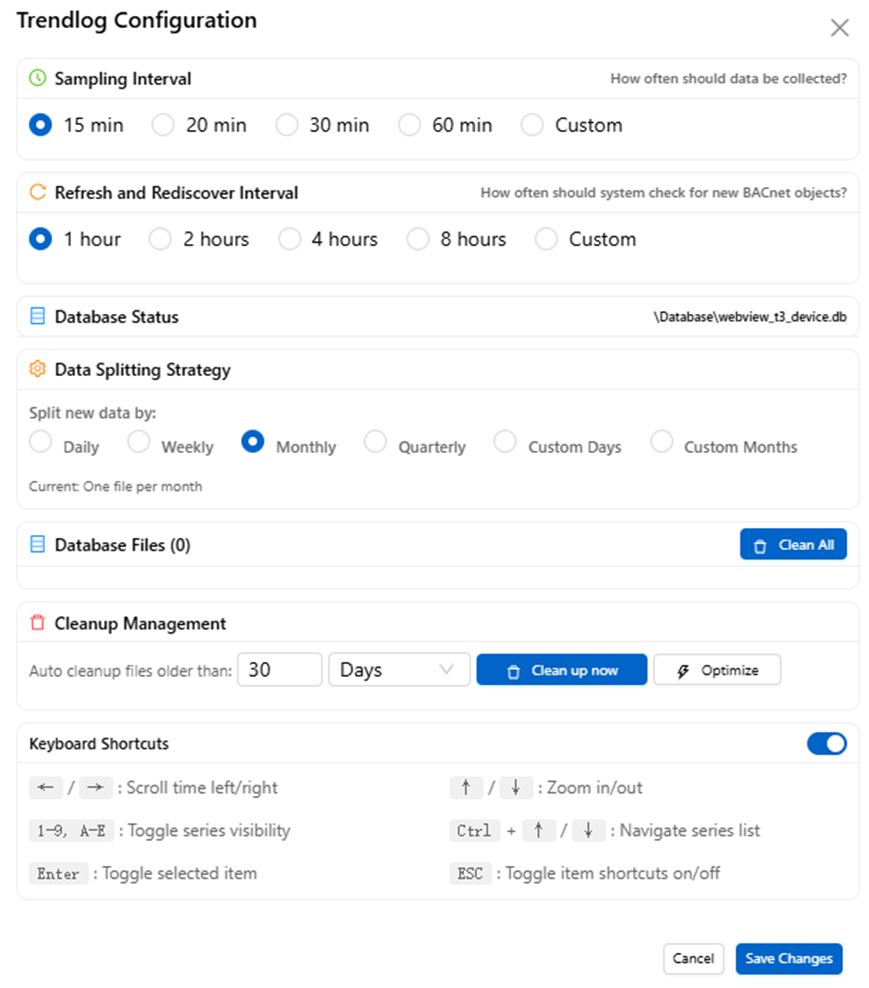
The Trend Log Configuration page defines the global behavior of the Trend Log Beta system.
Settings configured here apply to all Trend Monitors and affect how data is collected, stored, and maintained on the PC.
Sampling Interval
Defines how often trend data is sampled and written to the database.
• Preset options:
15 min, 20 min, 30 min, 60 min
• Custom:
Allows user-defined intervals (including sub-minute values, depending on system load)
This interval applies globally and determines the base resolution of logged data.
Refresh and Rediscover Interval
Defines how often T3000 scans for new or changed BACnet objects.
• Preset options:
1 hour, 2 hours, 4 hours, 8 hours
• Custom:
User-defined interval
This setting controls object discovery only and does not affect logging frequency.
Database Status
Displays the current database file location used by Trend Log Beta.
• Database is stored locally on the PC
• File format is an internal database file (e.g. .db)
• Path is shown for diagnostic and verification purposes
Data Splitting Strategy
Defines how logged data is split into separate database files over time.
Available strategies:
• Daily
• Weekly
• Monthly
• Quarterly
• Custom (days or months)
Example:
• Monthly → one database file per month
Data splitting improves manageability and performance in large systems.
Database Files
Shows the number of database files currently present.
Available actions:
• Clean All:
Deletes all existing database files (irreversible)
Cleanup Management
Controls automatic cleanup of historical data.
• Auto cleanup files older than:
User-defined number of days
• Clean up now:
Immediate manual cleanup
• Optimize:
Performs database optimization to improve performance
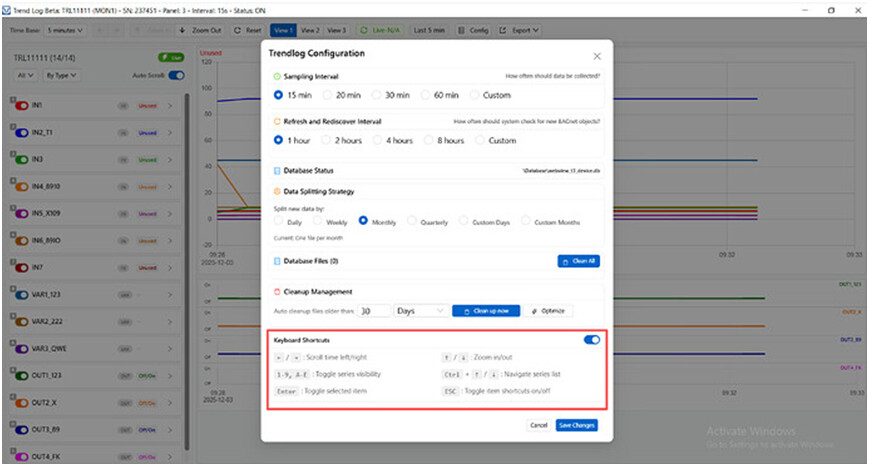
Keyboard Shortcuts
Provides optional keyboard shortcuts for faster navigation in the Trend Log graphic interface.
This section is informational only and does not affect data logging behavior.
Summary
The Trend Log Configuration page defines system-wide logging behavior, including sampling interval, data retention, and database management.
These settings apply globally and are independent of individual Trend Monitor definitions.
3. Data Storage Architecture
Trend Log data in T3000 is currently stored using a dual-layer storage approach, depending on the logging mechanism and system state.
3.1 PC-Based Storage (Trend Log Beta)
For Trend Log Beta, trend data is stored locally on the Windows PC running the T3000 application.
Key characteristics:
• Data is written automatically by T3000.
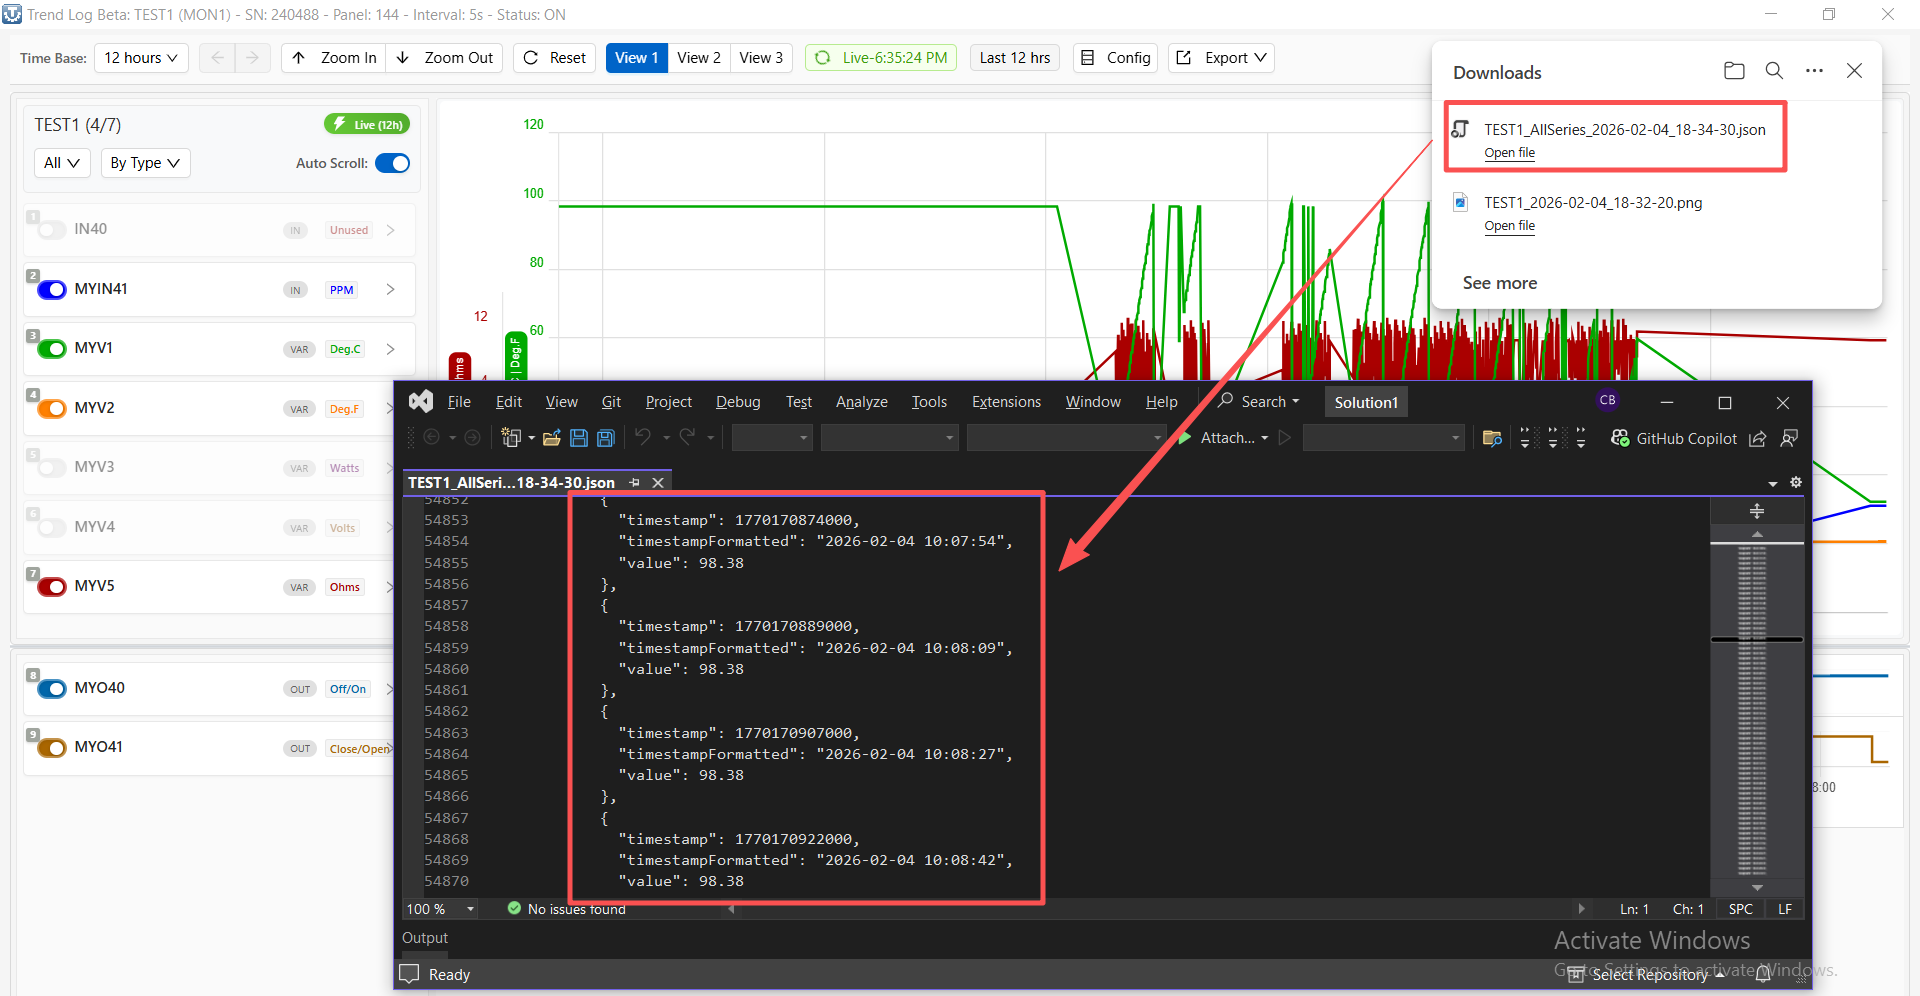
• Storage format is an internal SQL-based database.
• No manual database configuration is required by the user.
Important considerations (current implementation):
• The T3000 application must remain running continuously in order for logging to continue.
• The database structure and file location are considered internal and may change during development.
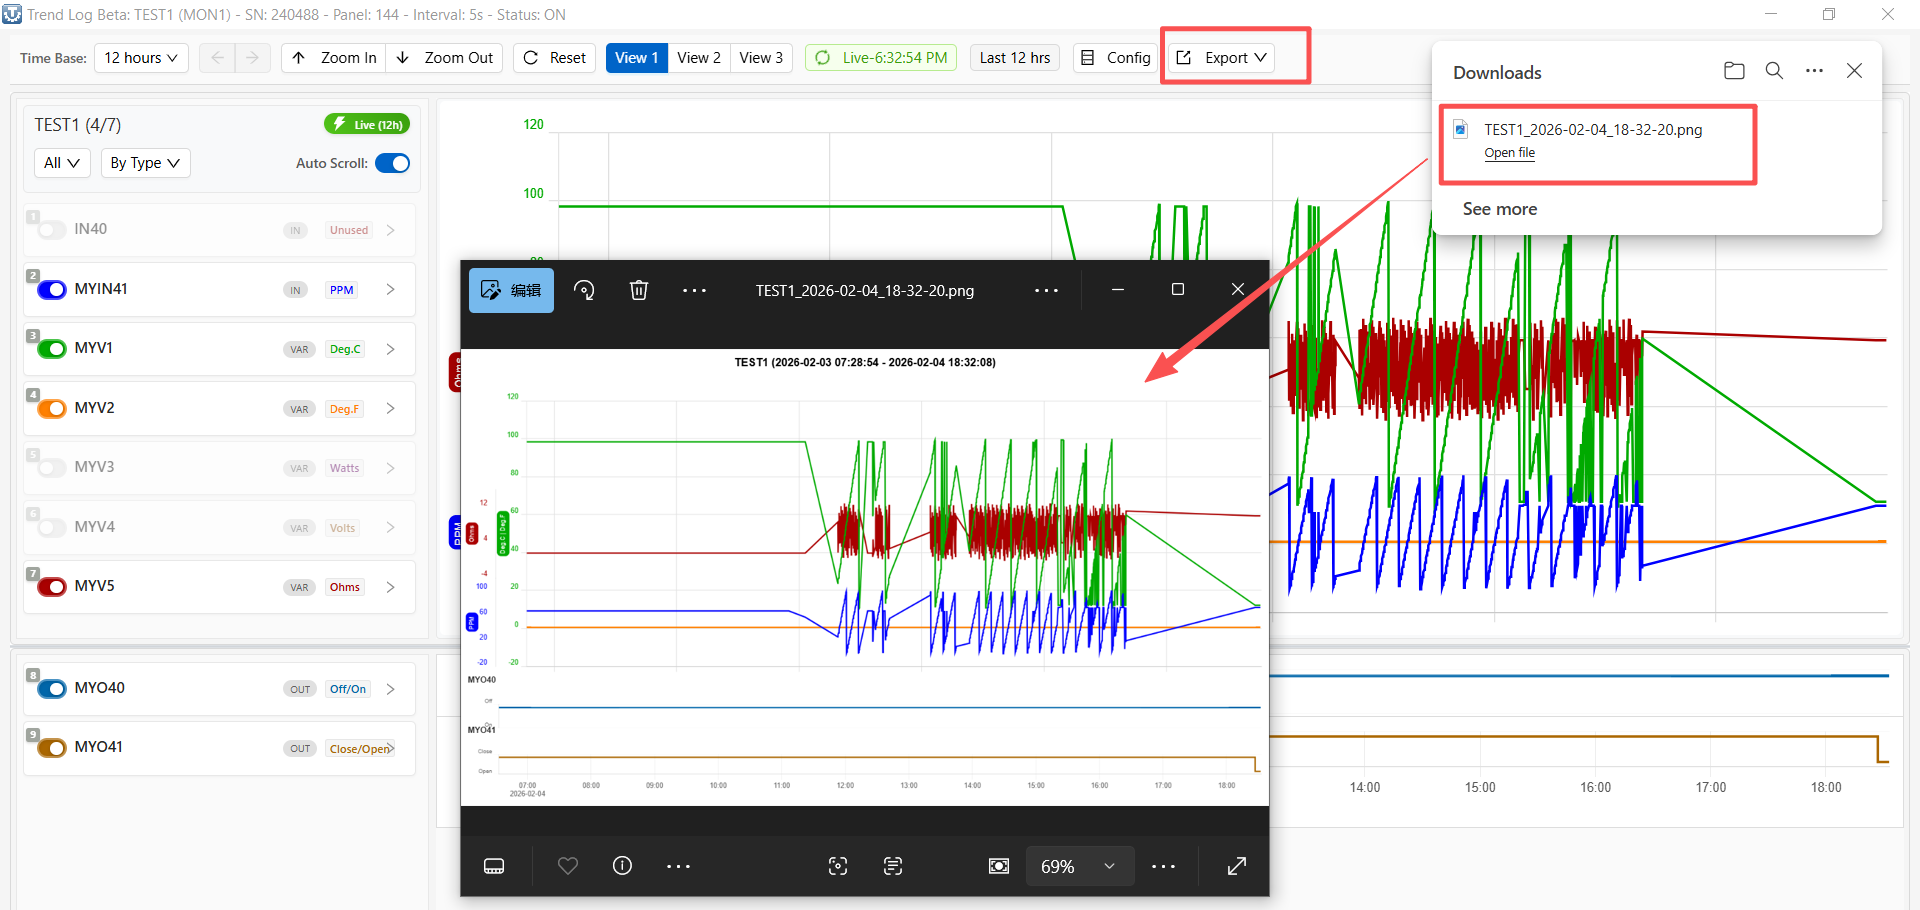
• At this stage, T3000 does not yet provide:
o A built-in database browser
o Direct export to CSV or Excel
o Automated reporting tools
These capabilities are planned for future releases.
3.2 Controller SD Card Storage
Some T3 series controllers (e.g. T3-BB) provide an SD card slot for local storage.
The SD card currently functions as a local data buffer, not as a user-facing data archive.
Behavior and characteristics:
• The SD card is automatically formatted by the controller.
• A controller reboot may be required for the SD card to reach Normal status.
• Data is stored as multiple .BIN files:
o Binary format
o Time-sliced files (approximately 100 kB per file)
o Separate files for analog and digital data
• When the SD card becomes full, older data is overwritten (circular buffer).
Current limitations:
• BIN files are not directly readable by Excel or third-party tools.
• Automatic synchronization between SD card data and the PC-based SQL database is not yet implemented.
• The SD card mechanism is primarily intended to support future features such as:
o Data backfill when the PC was offline
4. Usage Notes and Frequently Asked Questions
4.1 Does logging only occur when the Graphic window is open?
No.
Trend Log Beta runs as a background service. Logging continues as long as the Trend Monitor is enabled, regardless of which screen or page is displayed.
4.2 Can short logging intervals (e.g. 5 s or 10 s) be used?
Yes.
The logging interval can be configured in seconds, which is useful for commissioning, debugging, and monitoring fast-changing signals.
4.3 What happens when storage is full?
• On the SD card:
Older data is automatically overwritten.
• On the PC:
Data retention depends on available disk space and database management; no automatic purge policy is currently enforced.
4.4 Can trend data be exported to Excel?
At present:
• Trend Log Beta:
No official export tool is available yet.
• SD card BIN files:
Not supported for direct user analysis.
Export and reporting functionality is under active development.
5. Current Limitations and Scope
Trend Log Beta is an actively evolving subsystem. While the core data collection and visualization functions are stable, several limitations should be understood in the current release.
5.1 Continuous PC Operation Required
• Trend Log Beta relies on the T3000 application running on a Windows PC.
• If T3000 is not running, data is not written to the PC-based database.
• Full offline logging without a continuously running PC is not yet supported.
5.2 Limited Data Access and Export
• Trend data is stored in an internal SQL-based database.
• At present:
o The database schema is not exposed to end users.
o No built-in tools are provided for:
CSV export
Excel export
External BI or analytics integration
• Trend data is currently intended to be accessed and reviewed within T3000 only.
5.3 SD Card Data Accessibility
• Controller SD cards store trend data in a binary format.
• These files are not designed for direct user access or analysis.
• Automated synchronization between:
o Controller SD card data
o PC-based Trend Log Beta database
is not yet implemented.
5.4 Sampling Reliability Under Heavy Load
• Trend logging operates concurrently with:
o Program execution
o UI updates
o Network communication
• Under high system load, individual samples may occasionally be skipped.
• This behavior is being monitored and optimized in ongoing development.
5.5 Intended Use Scope
Trend Log Beta is currently best suited for:
• System commissioning and debugging
• Operational trend visualization
• Short- to medium-term historical review within T3000
It is not yet intended as a full-featured long-term data historian or reporting platform.